Performance Metrics
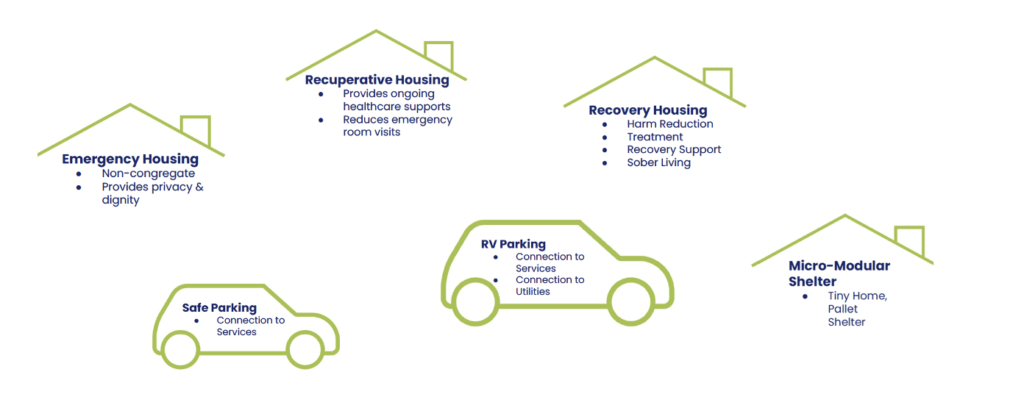
1. Temporary Housing
(i.e. Shelter / Safe Parking / Tiny Homes / Other)
Overall Success Metric
95% or greater of Homeless Households are residing in context-appropriate Temporary Shelter while working toward achieving Permanent Housing
Key Performance Inputs: Temporary Housing units
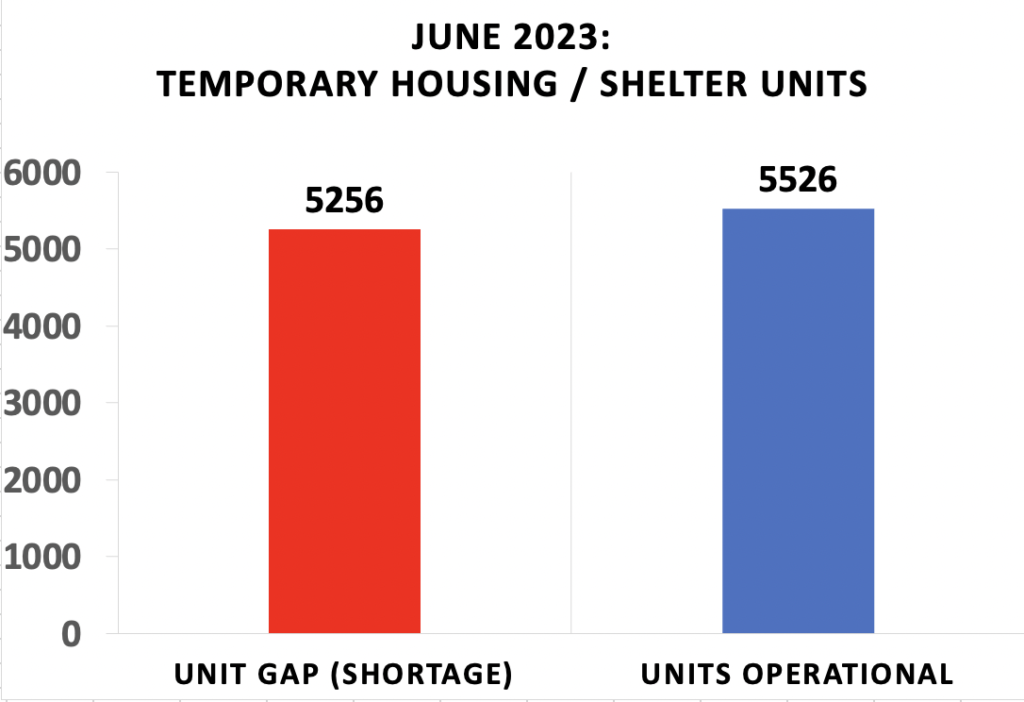
1. % of Operational Units vs. Gap (Shortage)
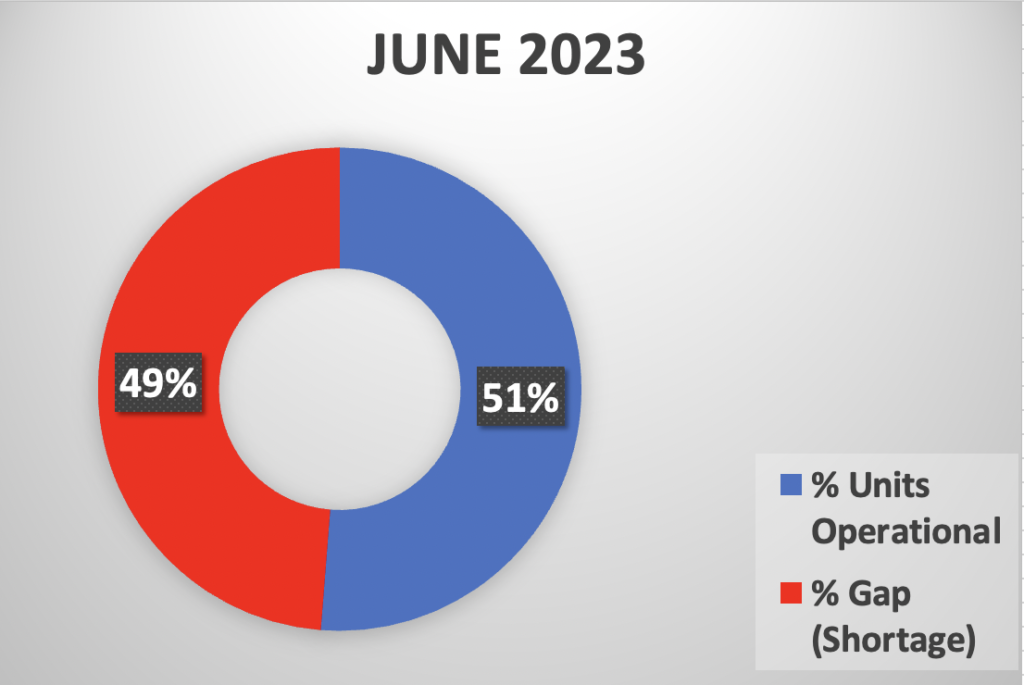
Gap(Shortage) Level: HIGH
2. Total Unit Need vs Units Operational
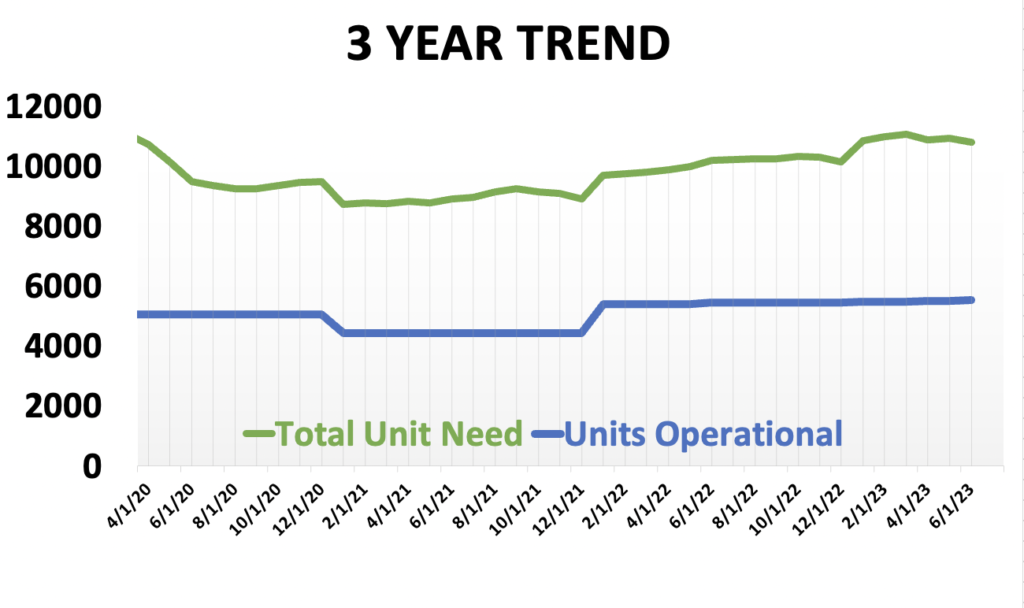
Gap(Shortage) Trend:
INCREASING, year-over-year
3. % Utilization (occupancy) of Operational units
Performance levels: +/- 2% = Green; +/- 5% = Yellow; +/- ≥ 6% = Red.
Apr2023 under-utilization of 8% = 440 additional households which could have been sheltered
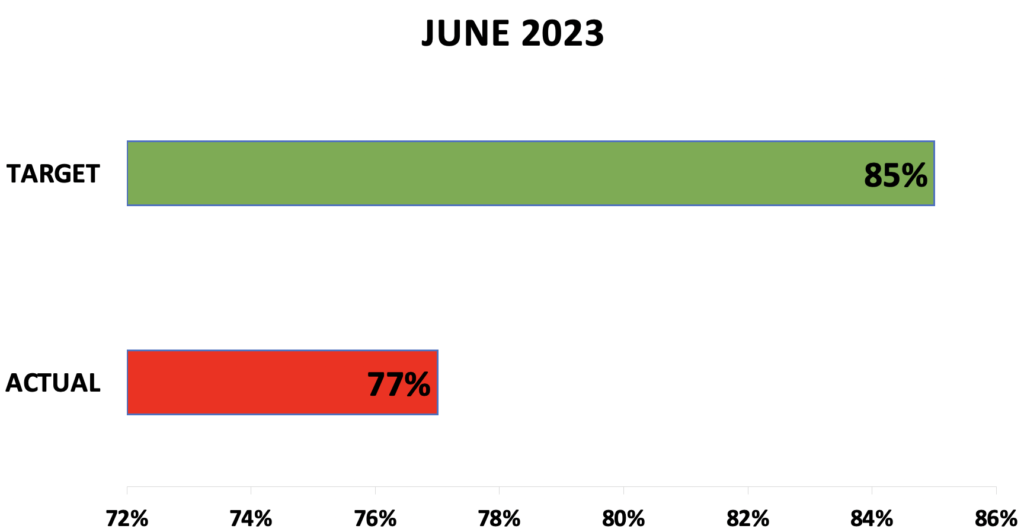
4. Annual Occupancy Rates vs. Target
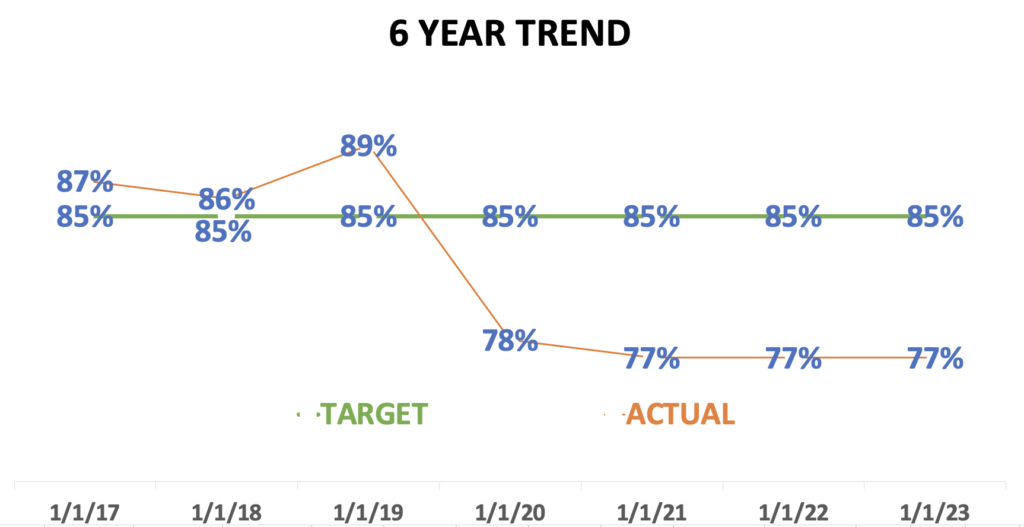
Utilization has historically performed above target, pre-Covid.
Key Performance Inputs: Services / Customer Experience
1. # of Touch-points per person
(For an example of this metric, refer to City of Issaquah’s dashboard)
2. Average # of homeless households per Case Manager
4. Average # of Days on Shelter Waitlists
5. Inflow / Outflow Monthly turnover rate

(For an example of this metric, refer to City of Houston’s dashboard)
6. % of Services Capacity available vs. Gap
(For an example of this metric, refer to City of Issaquah’s dashboard)