Additional Tools
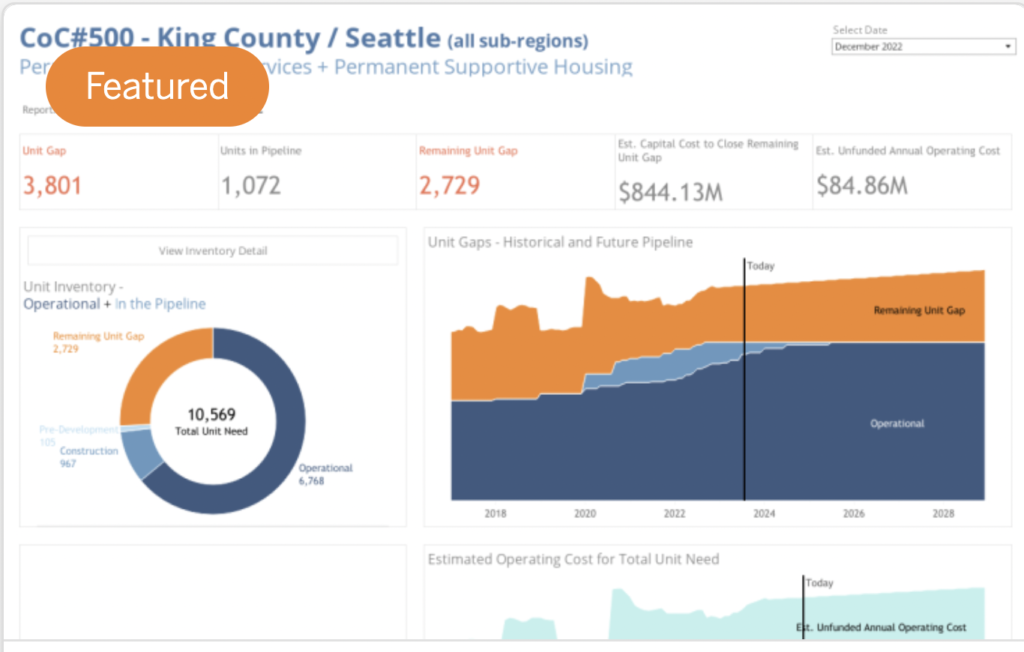
The Forecast Planning Dashboard
NOTE: currently only available for Permanent Supportive Housing (PSH) segment

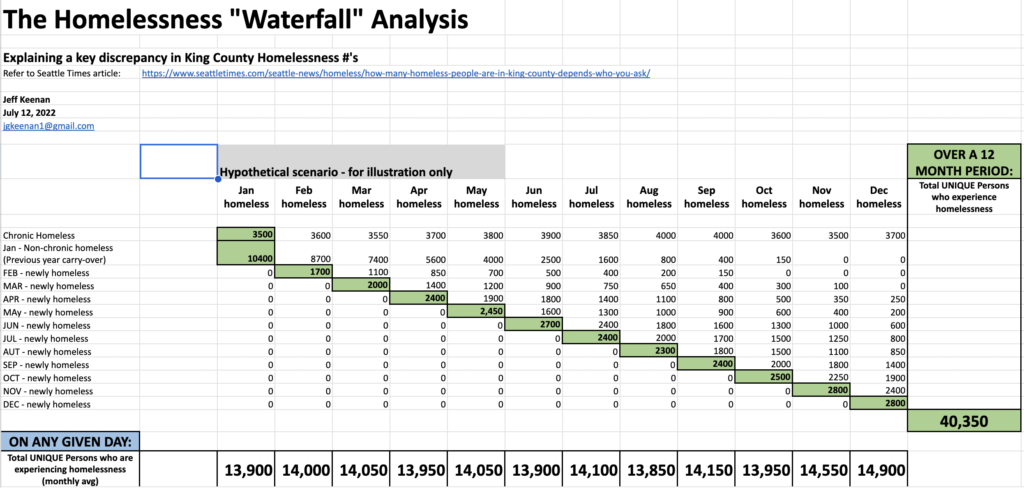
Homelessness “Waterfall” Analysis
Data visualization which demonstrates how the perceived ‘discrepancy’ between 13-15,000 vs. 40,000 Homeless persons is technically accurate, and both #’s are correct – but for different periods of time (monthly vs. annual).
And why 15,000 is the more relevant # for ‘solving’ homelessness, because it represents how many people we have homeless “on any given day”.
The 3 System “Total Systems Map”

