Performance Metrics
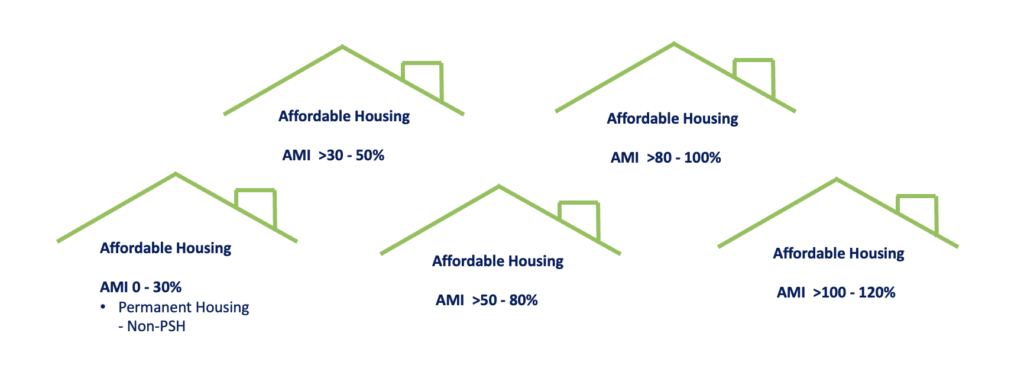
3. Affordable Housing
Overall Success Metric
For each AMI segment: Performance-to-Target remains “On track” for annual performance and 25-year Plan performance
(“AMI” = Area Median Income)
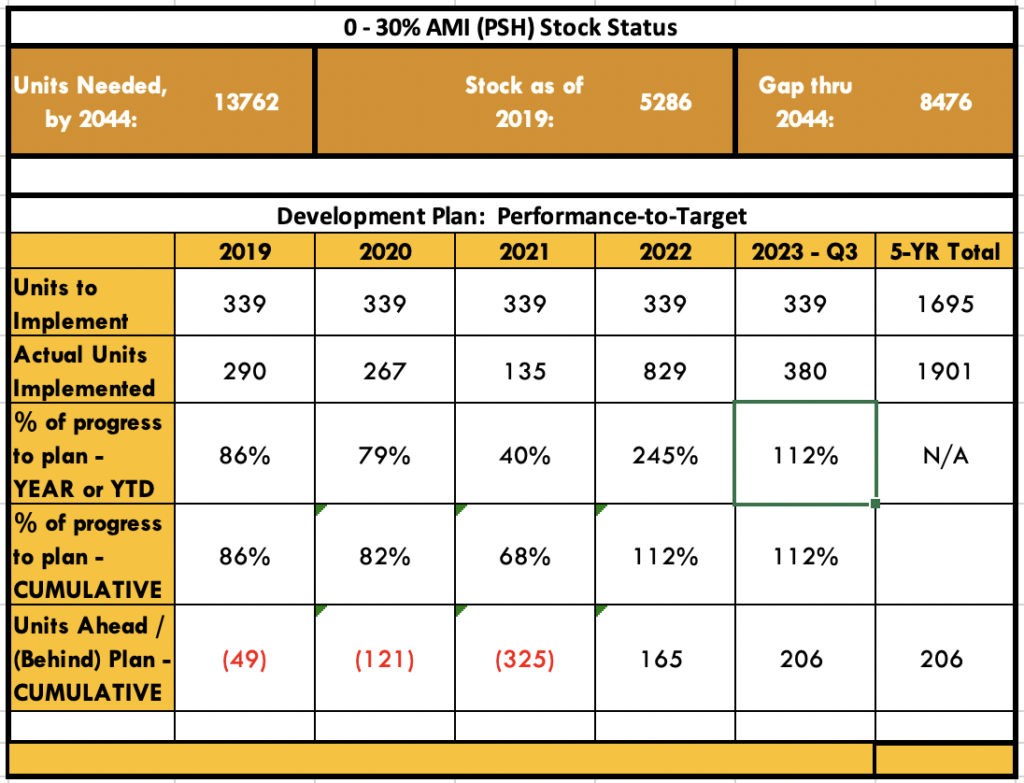
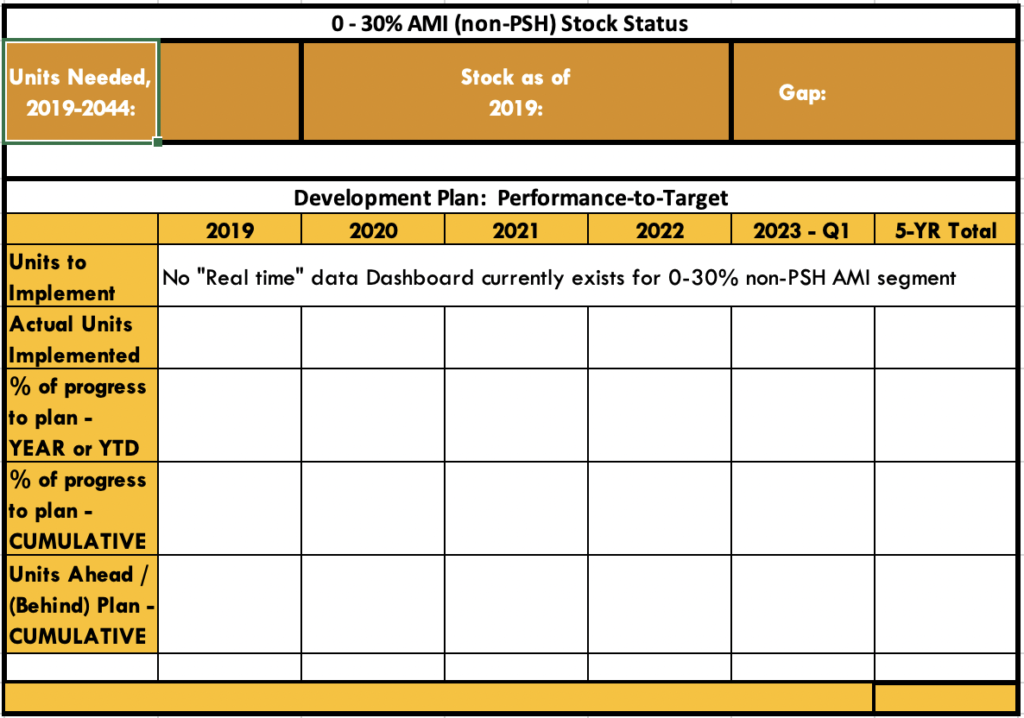
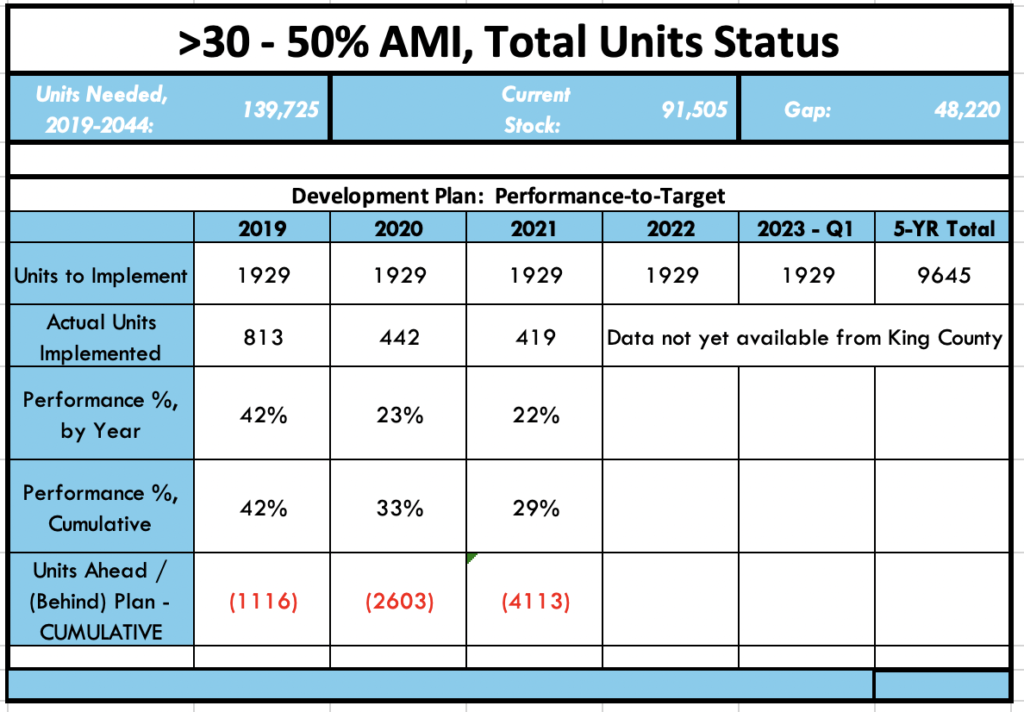
Performance-to-Target: Affordable Housing units
NOTE:
Gold/orange – utilizes HMIS ‘real world’ monthly data
Light blue – utilizes WA Dept of Commerce’s ‘modeled forecasting’ projections
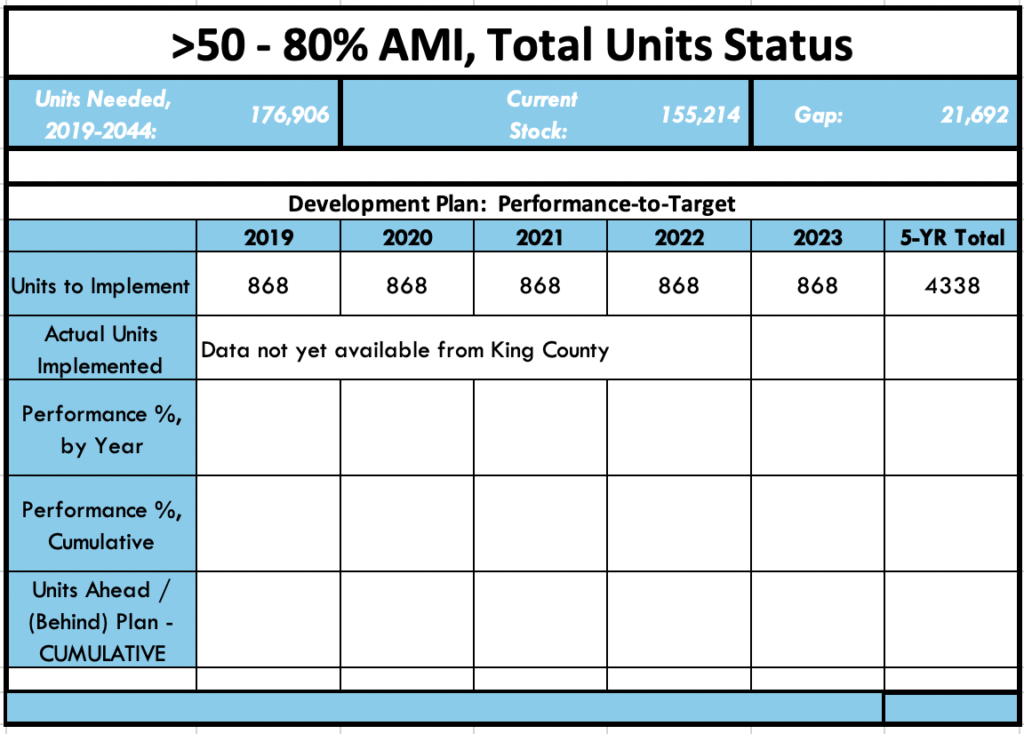
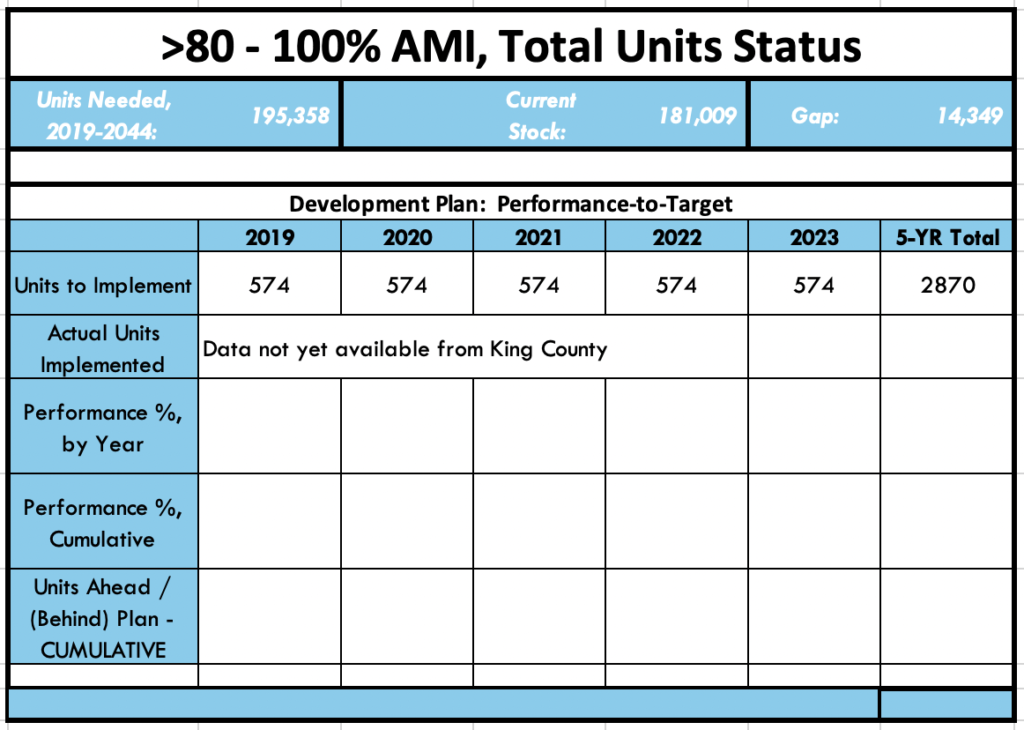
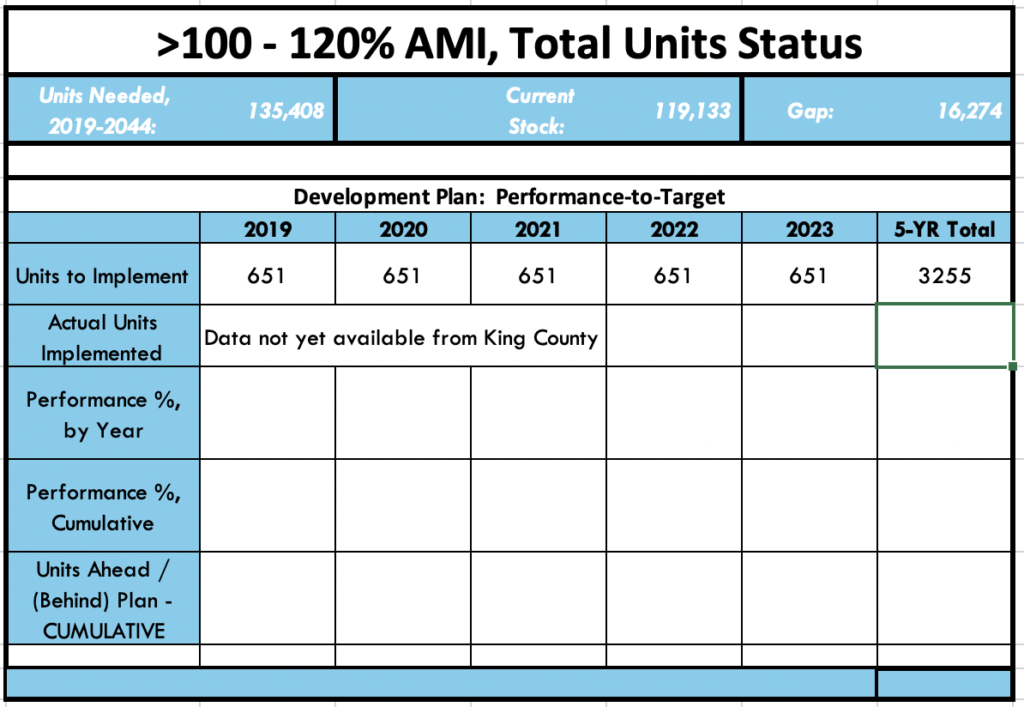
Performance Inputs: Affordable Housing – Leading indicators
1. # of Permits issued vs Target
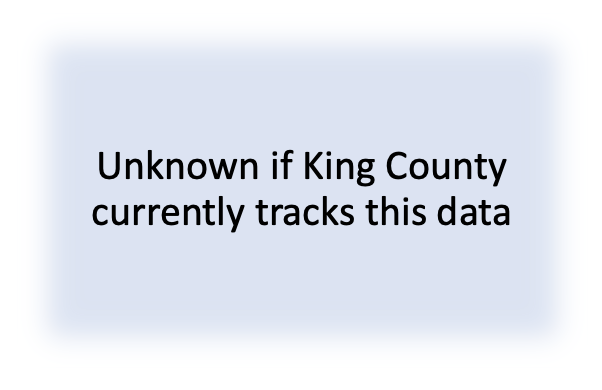
For an example of this metric, refer to Federal Reserve Economic Data (FRED) dashboard (for WA state), or City of Kirkland dashboard.
2. # of Affordable Housing starts vs target

For an example of this metric, refer to City of Kirkland dashboard.
3. Average Rent, per sq ft

Pending an example dashboard for this metric.
