Performance Metrics
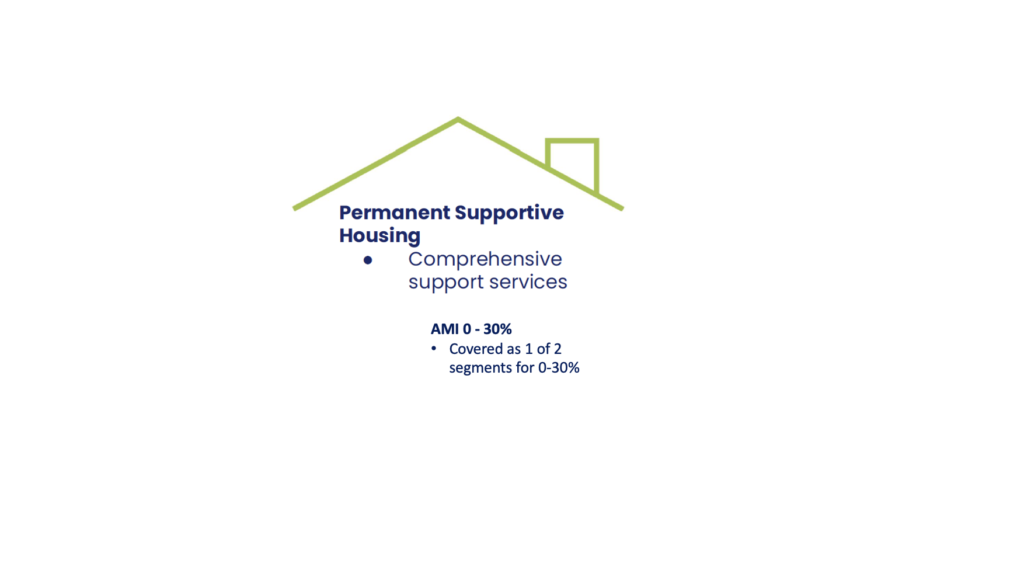
2. Permanent Supportive Housing (PSH)
Overall Success Metric
95% or greater of Chronic Homeless households are residing in Permanent Supportive Housing or Permanent Housing with support services
Key Performance Inputs: Permanent Supportive Housing units
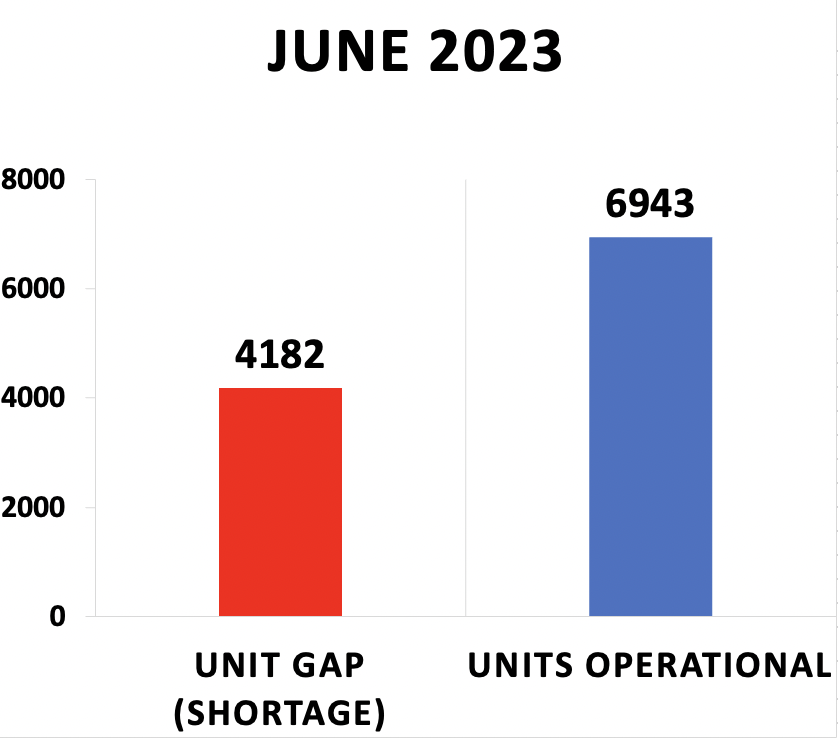
1. % of Operational Units vs. Gap (Shortage)
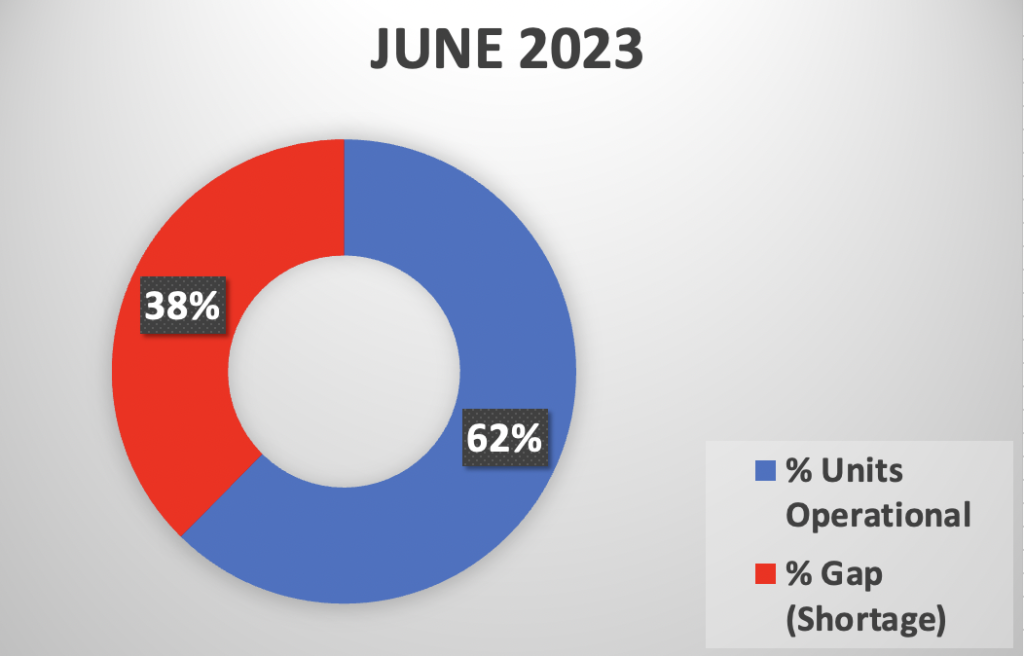
Gap(Shortage) Level: HIGH
2. Total Unit Need vs Units Operational
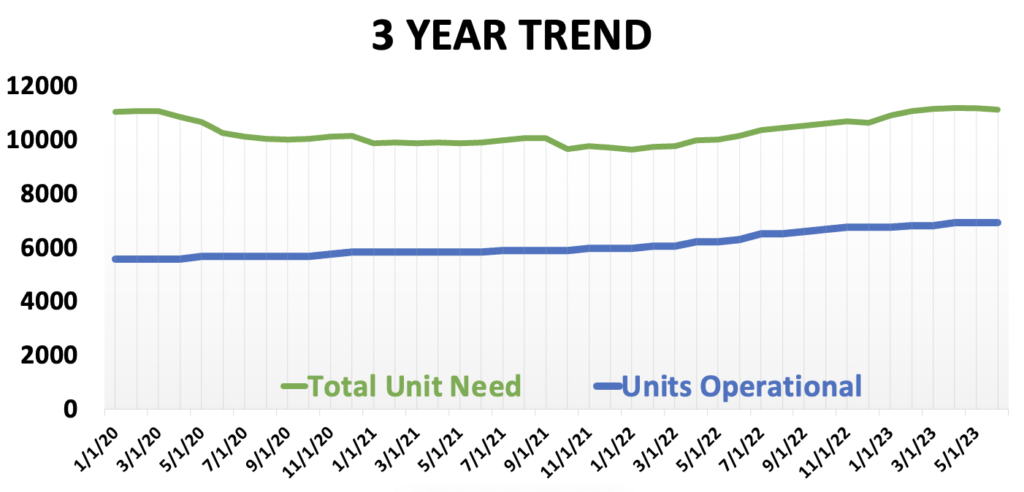
Gap(Shortage) Trend:
INCREASING, year-over-year
(NOTE: After reducing the gap from 5,488 in January 2020 to 3,672 in January 2022, the gap has since steadily increased to the current 4,187 unit shortage.)
3. % Utilization (occupancy) of Operational units
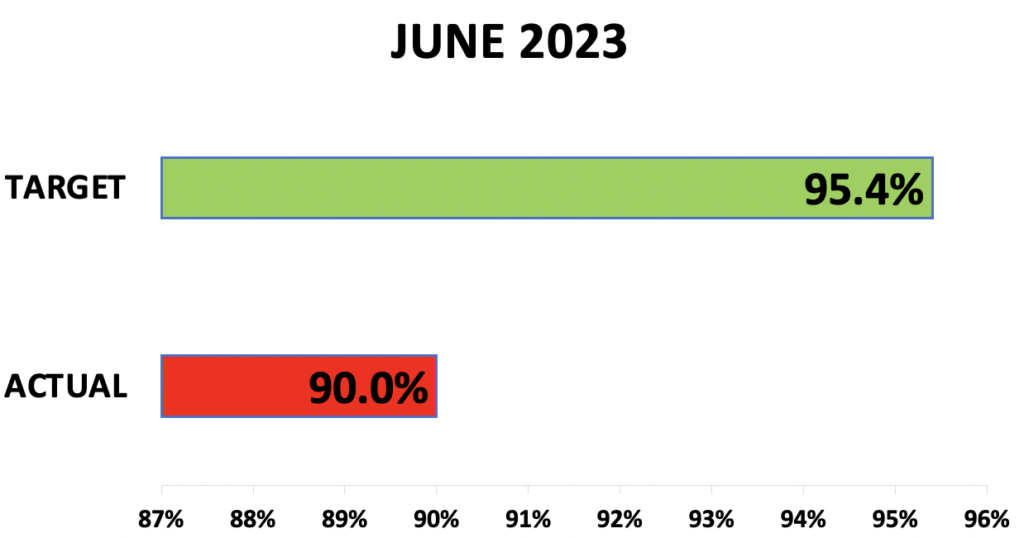
Performance levels: +/- 2% = Green; +/- 4% = Yellow; +/- ≥ 5% = Red.
NOTES:
- 5.4% = 358 add’l chronic homeless who should be permanently housed.
- This would also decrease the Temporary Shelter unit gap by 421 units.
4. Annual Occupancy Rates vs. Target
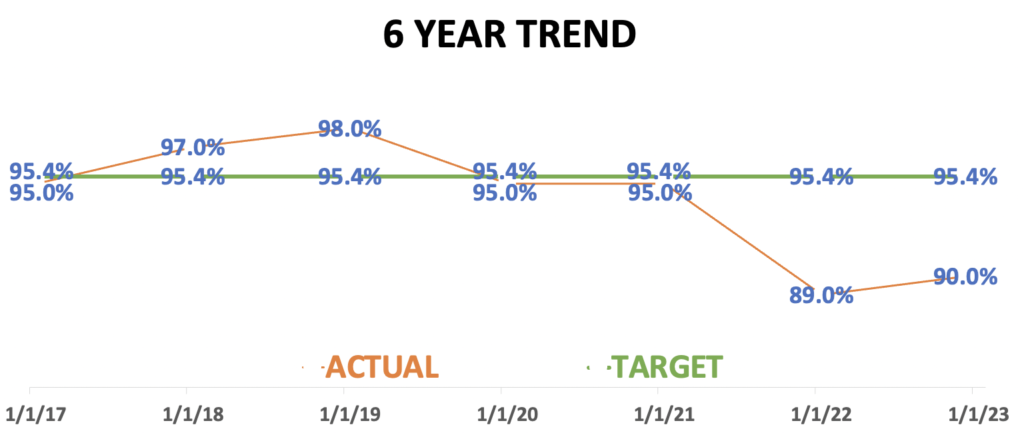
Utilization (occupancy) rate has historically achieved or exceeded target, until the most recent 2 years.
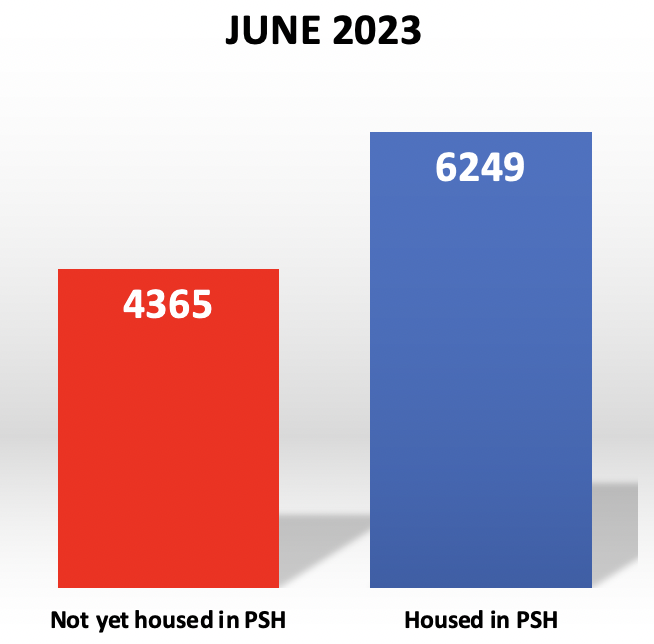
Housed vs. Un-housed Chronic Homeless
Key Performance Inputs: Services / Customer Experience
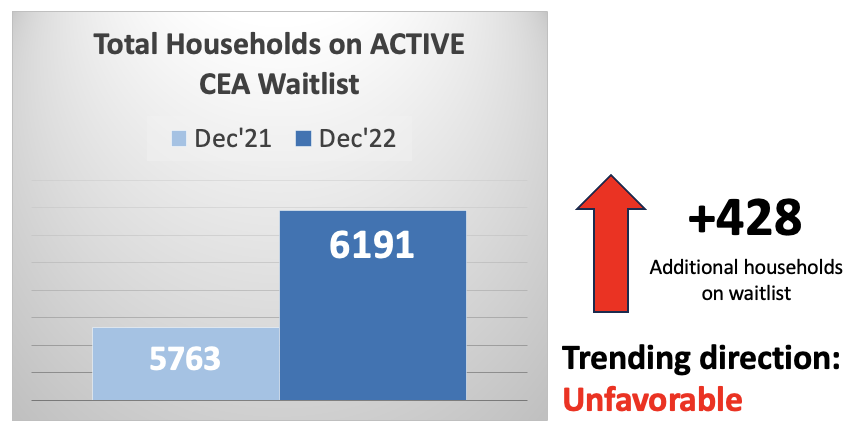
1. # of Households currently on CEA Permanent Housing waitlist
(“CEA” = Coordinated Entry for All)
2. Average # of Days spent homeless while on CEA Housing Waitlists
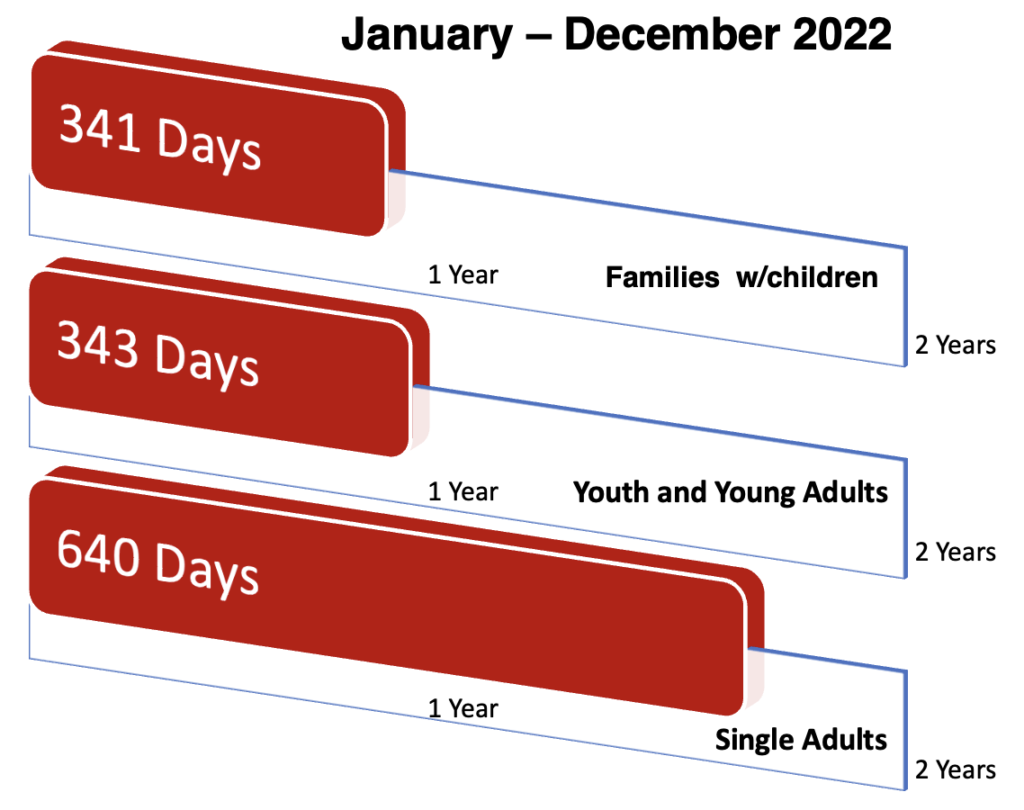
King County does not have published Targets for # of Days acceptable on Housing Waitlists.
3. % of CEA Waitlist households given update on status in past 30 days
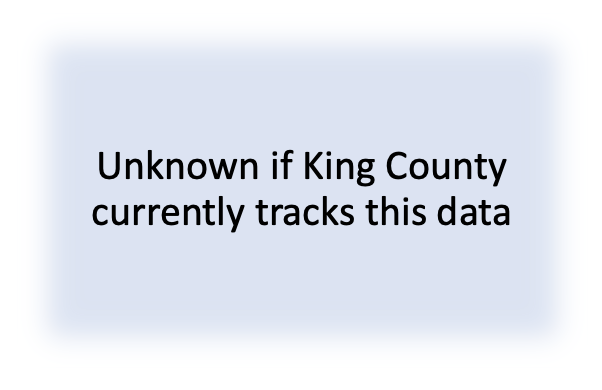
4. Average # of Households per Case Manager

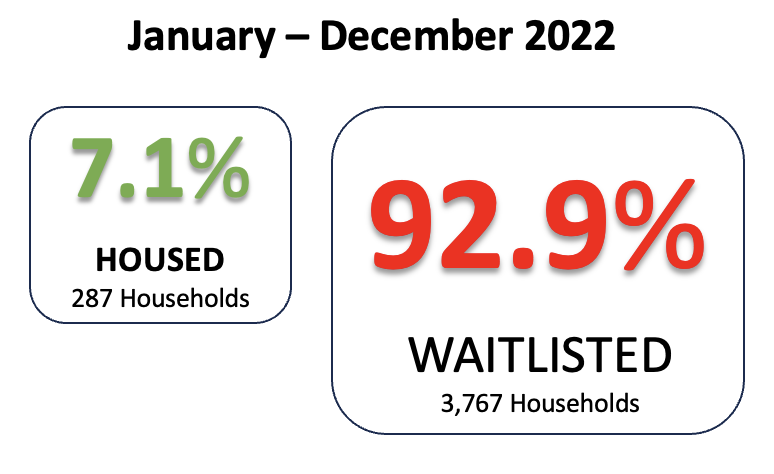
5. % of CEA Assessed households moved to Housing vs. Waitlisted
